Wednesday, February 17, 2016

Biggest sunspots since 1990: larger than a transiting Earth

This plot was inspired by this web page (History's Biggest Sunspots) and uses data from this database (DPD). It presents the area of the biggest sunspot of each month since January 1990. The sunspot area is given in millionth of the solar hemisphere, so 1000 means that 0.1 % of half of the Sun's surface is covered by the spot.

So why is this interesting for my exopanet blog? If we take a look at the radius ratio between Sun and Earth, which is about 110, we see that a transiting Earth will reduce the solar brightness by about 1/(110)² = 1/12100, which is approximately 100 millionth.

A comparison with the plot shows that there was almost no month in the last 25 years where the Sun did not have at least one spot with an area larger than 100 millionth of the solar hemisphere. So almost all of these spots cause brightness reductions larger than the transiting Earth. The Sun is not even a very active star, so chances are that many other stars have even more and larger spots. This might give you an impression why it is pretty hard to find small transiting planets around active stars.

However, the good thing is that spots change. The brightness variations they imprint on lightcurves are quite different from exoplanetary transits and they always change with time - although sometimes they change very slowly. A transiting planet usually does not change its transit (although there seem to be exceptions), so the same signal is coming again and again at a predictable time. If the transit is changing, either its shape or its transit time, you always have to be extra cautious because this takes you very close to what spots do.

By the way, this plot also shows the 11 year activity cycle of the Sun. Around 1997 and 2009 you can see periods with only very few and comparatively small spots. In between the biggest spots are much larger. The magnetic activity of the Sun changes: when it is high, it has a lot of spots and also many large spots; when it is low, you sometimes even have periods of days where not a single spot is seen. These magnetic cycle are also an issue when searching for exoplanets, although not so much for transit surveys. You can see the different levels of activity of a star in the radial velocity measurements, which might mimic the signal of a far-out planet with a long period. Again, stellar activity can mess up things quite a bit.


Sunday, February 14, 2016

Exoplanet discoveries: The growing number of planets


People have been searching for planets ('wandering stars') for thousands of years, but the first detection of a planet around another star - not the Sun - was not that long ago. It has been suspected for a long time, but we only know since about 25 years that there actually are other planets orbiting around other stars.

If you take a look at the chart on top, you can see the number of known exoplanets over their discovery date. Usually, 51 Peg b is referred to as the first detected extrasolar planet - that is why I marked it with bold letters. However, it is easy to see that this is not the entire story of the detection of the first exoplanets. Clearly, there were five planets discovered before 51 Peg b - so what's the problem with them?

I guess the problem with these planets was three-fold. First, some people had a hard time believing the data. Especially the early detections by the radial velocity technique were not absolutely convincing because researchers were at the very limits of what their instruments could do. Second, the PSR planets are bodies with low masses around pulsars. Pulsars are neutron stars, stars at the end of their life cycle. This was not expected and many people were wondering whether this could really be a planet. Third, the first two exoplanets detected were huge with masses higher than 10 Jupiter-masses. Again, people were not sure whether this is a planet or not rather something like a 'small star'. In 1995 Mayor and Queloz presented a very clear signal of a planet with half the mass of Jupiter orbiting the solar-like star 51 Peg. This was so convincing that most scientist soon accepted it as the first definitive detection of an exoplanet.


This plot shows you the number of exoplanets per detection technique. The first thing that hits the eye is the huge number of detections by 'primary transit', which is the transit method. Half of the currently known planets were found using this technique. The second-most successful method is the radial velocity method.

In 2014 the number of detections peaks with almost 900 exoplanets found in this year. This is a little bit misleading because most of these planets were already known as Kepler planetary candidates - unconfirmed planets found by the Kepler mission. In 2014 many of these unconfirmed planets were suddenly counted as real planets, not because they actually were confirmed by e.g. detection with some other method (preferably RV), but based on a statistical argument. The short version of this argument is: Kepler planetary candidates with some specific properties (e.g. being part of a multi-planet system) are virtually always real planets.

It is interesting to see that the number of exoplanet detections seems to go down. The number in 2015 was lower than 2011, 2012, and 2013. This is certainly no real effect in the sense that there are no more new planets to be found out there. It rather reflects the fact that large, successful missions to find transiting planets, like CoRoT and Kepler, have ended and less data is obtained. Although there certainly will be new instruments dedicated to detect new exoplanets, with a number of more than 2000 known exoplanets the focus will probably shift to missions characterizing a selection of particularly interesting exoplanets in detail.


When presenting each detection method separately, we can see better how the number of detections is developing for each technique. The only method I do not show here is the astrometry technique which - according to exoplanet.eu - only has one detection.

The numbers coming from the RV method are more or less constantly rising since the 90s. Although it is resource intensive because one needs large telescopes and highly RV-stabilized spectrographs, this is our most important technique to detect the mass of exoplanets. Getting high-resolution spectra of the exoplanet system also helps analyzing other properties of the star and the planets.

After the detection of the first extrasolar planetary transit in 1999, most of the transiting planets came from Kepler from about 2010 on. Although the transit method is comparatively simple, the numbers go back since the Kepler main mission is over (and K2 is not obtaining as much and as good data). Data from ground is just not as fruitful, although it is producing a lot of results.

The numbers for microlensing and imaging are rising since about 2005. I hope this will continue because it is very good for our statistical understanding of exopanets; these methods probe different properties than RVs and transits, e.g. planets far away from their host stars, which will help to understand better how many planets there are, where they are, and what characteristics they have.


Wednesday, August 5, 2015

All sky map of exoplanet host stars: Surveys (exoplanet.eu)


There are many different surveys looking for new extra-solar planets. Right now the most successful technique is the transit method and there are many programs using this method. In this all sky map I was trying to show a few of these surveys which look at many stars, monitor their brightness, and try to find exoplanets in the stars' light curves.

Probably the most well-know survey is Kepler; it's the instrument that found the most planets until now. However, it looked at a very limited area of the sky. You can see it on the left side of the map where the large number of black dots are.

CoRoT was another space-based mission which was very successful; however, it did not nearly find as many exoplanets as Kepler. Its observing strategy was a bit different. CoRoT did not stare at one area in the sky all the time but switched its field of view every half year. One time it looked in the direction of the center of the Milky Way, which are the purple squares on the left side, and the next time it looked at an area in the opposite direction. These so-called 'anti-center' runs can be seen in the center of the map.

Also very successful is WASP. The nice thing about this survey is that (1) it observes from the ground and (2) it looks (almost) everywhere in the sky. The 104 planets I got from exoplanet.eu (including SuperWASP) are really quite a number.

There are lots of different missions listed in the legend of the map and I do not want to go into detail on everyone of them. It is not a complete list of programs but rather what I could made out of the information provided by exoplanet.eu. Unfortunately, it is kinda hard to find which planet was detected by which survey because this is not listed there. So the host stars (and planets) I plot here are named after the program they were found with - and this way I could plot them. However, this is not true for every planet found and also not true for every survey.

This is especially disappointing for the planets found with the RV method. I would have liked to plot all the RV planets coming from, e.g., HARPS, which is an amazingly successful instrument, but I could not easily collect the necessary information. The host stars usually keep their name because they are bright, well-known objects (with HD or HR numbers). So it's not possible for me to get the survey from the name alone.

After all, this map is supposed to give an impression of which transit surveys there are and how they observe. It's not meant to be complete. Furthermore, the detection method listed in the database is not always 'transit'. This is because some systems are re-observed in RV to get the mass of the planet. Others, e.g., OGLE are no transit survey, although they do observe light curves. It can by chance also find transits but OGLE is actually looking for the signatures of microlensing events.


Tuesday, August 4, 2015

All sky map of exoplanet host stars: Multi-planet systems (exoplanet.eu)


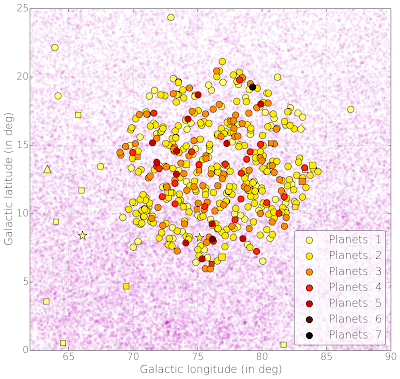
With this post I continue my series on exoplanet host star all sky maps. What you see is basically the same thing I showed two posts ago. This time, however, I choose the color to represent the number of exoplanets in the system. So the symbol tells you which method was used to detect the system and the color tells you how many planets are know right now in this system (August 3, 2015, exoplanet.eu). The 740 lightyellow-colored host stars have only one planet, the one black circle in the Kepler field of view (Kepler-90 alias KOI-351) is the only exoplanet system with seven planets - all transiting the host star.

The Kepler field of view is so crowded that I include a zoom in on this region; it's the figure on the left side. The only seven planet system is on the top right of the Kepler FOV whereas the only transiting six planet system (Kepler-11) is pretty much at the bottom. In the all sky map you can see three other six planet systems, however, these where detected with the RV method.

Monday, August 3, 2015

Exoplanet host stars: The Kepler field of view (exoplanet.eu)


This is an addition to the post before. The plot shows the Kepler field of view in detail, all symbols and colors stay the same. This is the region in the sky from which we - by far - know the most planets around stars. Until July 23, 2015, Kepler has discovered 1879 confirmed exoplanets around 471 stars (according to exoplanetarchive.ipac.caltech.edu).

Sunday, August 2, 2015

All sky map of exoplanet host stars (exoplanet.eu)


Today I'd like to show something not directly connected to the last couple of posts. This is an all sky map of exoplanet host stars. Different colors/symbols indicate the method used to detect the planet. The data was taken from exoplanet.eu. Actually, I tried to plot all planetary systems know today, which according to exoplanet.eu should be 1228, but for some reason I am missing three in the transit method.

The underlying magenta colored points are about one million stars from the Tycho catalog (ESA Hipparcos satellite). The map is an aitoff projection of the sky in galactic coordinates and the Milky Way lies at the equator; this is why most of the stars are located there.

Most of the planets are detected with the transit method. However, the majority is located in the small area crowded with black dots - the Kepler field of view. When we talk about statistics of transiting exoplanets we are actually talking about a small part in the sky and not the entire sky. Astrophysicists just assume that it should be the same everywhere. The other black dots come from different surveys, e.g., CoRoT or WASP.

The picture is different when looking at planets detected with the radial velocity (RV) method. They seem to be more uniformly distributed. It's the second most successful technique with 454 stars having planets around them.

At least according to exoplanet.eu, so far there is only one astrometry planet and it is very close to the Kepler FOV - although it's not in it. The star is HD 176051 b. So far it seems to be too difficult to detect planets with this method, but it is expected that with GAIA there will be many planets coming from this technique.

Imaging seems pretty much located to certain areas, avoiding the plane of the Milky Way as much as possible. This is probably a good idea since background stars that coincidentally stand close to the potential host stars make it more difficult to find planets - or might even be misinterpreted as bodies belonging to the system.

All microlensing planets come from a limited area in the direction of the center of the Milky Way, which in this map is at the edge. This illustrates nicely that microlensing really samples a quite different population of stars. All other techniques try to go away from the galactic center (and even the galactic plane) and only find exoplanets rather close to the Sun. The most distant microlensing planet, however, is about 25000 light years away - virtually in the center of the Milky Way.

The transit timing variation (TTV) planets are all in the Kepler FOV. For this method one needs good light curves and a long cadence to cover many transits, and this is what Kepler does best. According to exoplanet.eu there are only four TTV planets - which I do not think is true; there have to be much more. exoplanets.org says it's more like 60 (including some pulsar planets), which I believe is closer to the real number.

Finally, we have the planets around pulsars. There are a few in the Kepler FOV, but otherwise I do not really see a system there. I think it is nice to notice that PSR 1257 12 b is the star with the first exoplanet detection in the year 1992 - and it actually is a three-planet system! I think is has to be one of the two triangles in the upper right. Usually, people cite 51 Peg b as the first exoplanet - it was the first around a solar-type star. I guess pulsars are just too different ...


Thursday, July 30, 2015

Transits: Limb darkening - HD 209458 b in different colors (HST)

In the previous post I presented theoretical transits of how the exoplanet HD 209458 b should look like in different colors. Now I will show how its transits really look like.

On the left you see observations of the Hubble Space Teleskope (HST) from 320 to 970 nm. The last transit, which is much nosier, is not from HST but Spitzer - a NASA space misson for infrared observations.

Actually, HST observed many spectra of the star covering a full transit. By averaging over different parts of the spectrum you get the transit in a certain color. The central wavelength of the interval over which was averaged is given on the right side of each transit. The colors range from the ultraviolet to the near-infrared.

The Spitzer data is special because it lies at a much higher wavelength in the far-infrared. There the star should have virtually no limb darkening anymore and the transit has a box shape. However, you cannot see that very well because it is much more difficult to get precise brightness measurements for these wavelengths. The star is much fainter there and, thus, the noise is much higher. Also the two instruments are pretty different which leads to non-equal measurement errors.

In the last post I showed what we should expect from theory - and the observations agree nicely with it. In UV and blue the shape of the transit is much rounder than for longer wavelength. Indeed, limb darkening is stronger for shorter wavelengths.

It is actually pretty hard to measure the limb darkening of stars; they are just too far away to spatially resolve them. Analyzing exoplanetary transits is one of the best methods to verify whether the theoretical predictions are really correct. And so far the models seem to work pretty well - although in detail observations and theory are not so easy to compare. After all, the exact shape of the transit depends on a lot of different things.