Now let us take a look at limb darkening in transits. In the beginning I will start with theoretical transits - transit lightcurves generated on the computer. This makes explanations a bit easier, we will come to real data soon enough.
For demonstration purposes I chose one of the best known exoplanets today: HD 209458 b. In 1999 this was the first transiting planet ever observed (Charbonneau 2000), a true milestone in the history of astrophysics. It is a huge planet, about 1.3 times the radius of Jupiter but only 70 % of its mass. It is a good planet to start with because its large size results in a deep transit.
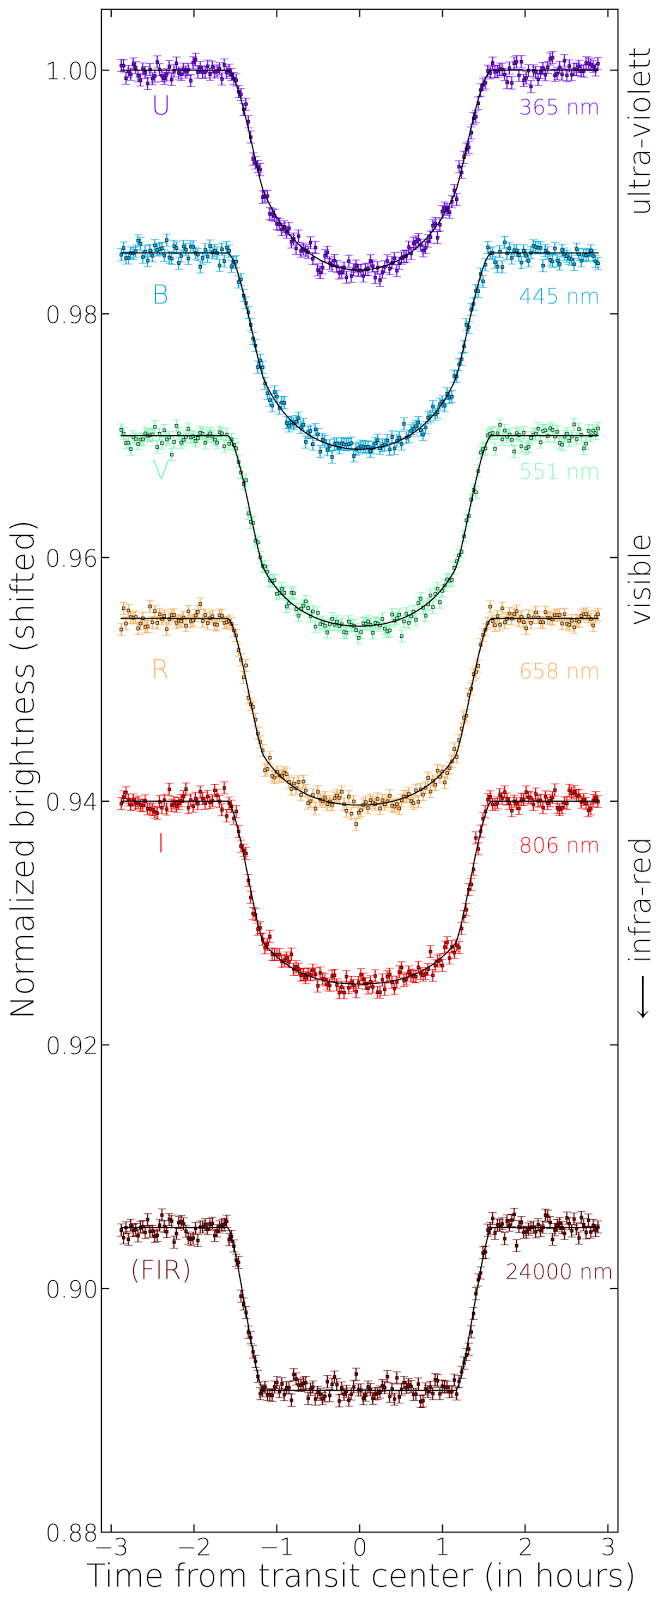
The figure on the left side shows simulated transits of HD 209458 b for different wavelengths. This is interesting because the limb darkening of the star depends on the color you are looking at. So in different colors the transit shape will be different. I added a bit of noise to the lightcurve to make it look more like a real observation. The noise is roughly consistent with the uncertainty of the Hubble Space Telescope data of this planet I will show in the next post.
All transits are normalized meaning that the (average) brightness outside of the transit is one. However, if I plot them all over each other we would not see them very well anymore; so transits observed at longer wavelengths are shifted downwards. The corresponding wavelength (in nm) is given on the right side of each transit lightcurve. On the very right it is indicated to which wavelength regime (UV, visible, IR) this wavelength belongs. Keep in mind that visible light goes from 380 to 750 nm.
The x-axis shows you the time of the observation of each data point in hours from transit center; the transit duration of HD 209458 b is about three hours.
What can we learn from this figure? Due to the limb darkening the transit shape is round for blue colors (shorter wavelengths) and gets more box-shaped for red colors (longer wavelengths). When going further into the infrared, the transit looses its round shape completely because there is (almost) no limb darkening of the stellar disk anymore. In real data this would be nice because dealing with limb darkening can be a nuisance; you just have to deal with a few parameters less you do not really know for sure. However, it is not that easy to obtain high-quality transit lightcurves in the infrared - even for the best instruments scientist have right now. This is what I will show you in the next post.
What can we learn from this figure? Due to the limb darkening the transit shape is round for blue colors (shorter wavelengths) and gets more box-shaped for red colors (longer wavelengths). When going further into the infrared, the transit looses its round shape completely because there is (almost) no limb darkening of the stellar disk anymore. In real data this would be nice because dealing with limb darkening can be a nuisance; you just have to deal with a few parameters less you do not really know for sure. However, it is not that easy to obtain high-quality transit lightcurves in the infrared - even for the best instruments scientist have right now. This is what I will show you in the next post.
Addendum: A more technical note at the end. On the left side of the transits in the figure letters are written: U, B, V, R, I (and FIR). These letters indicate the photometric bands (Johnson filters) used to simulate the transit lightcurves which are important to know the theoretically expected limb darkening. If you know your star and the photometric filter, you can calculate how the limb darkening should be. Here I use the non-parametric limb darkening coefficients for the Johnson filters for a Sun-like star published in this paper.
FIR is not a real filter; it stands for far-infrared. I just assumed at this long wavelength the limb darkening is zero. This way we have a comparison how the transit would look like if there is no limb darkening at all.
FIR is not a real filter; it stands for far-infrared. I just assumed at this long wavelength the limb darkening is zero. This way we have a comparison how the transit would look like if there is no limb darkening at all.